
I am the Economy, James “Yaya” Hough, State Correctional Institution – Phoenix, PA

Table of Contents
I. Introduction
III. What’s New This Year
IV. Sector Summary & Developments
V. Data
VI. Methodology
VII. Acknowledgements
Introduction
Today, more than half of the $80 billion spent annually on incarceration by government agencies is used to pay the thousands of vendors that serve the criminal legal system. They are healthcare providers, food suppliers, and commissary merchants, among others. And many have devised strategies to extract billions more from the directly impacted communities supporting their incarcerated loved ones.
Companies like Securus and Keefe charge as much as $25 for a simple 15-minute phone call and $6 for mere $20 deposit, respectively. Focused on their bottom line, advantaged by an obscure environment, and often empowered by monopolistic contracts, these private, for-profit corporations that operate within the prison industrial complex exploit the 2.2 million people incarcerated in the U.S. and their support networks, both vulnerable to corporate abuse.
This report exposes roughly 4,000 corporations that profit from the devastating mass incarceration of our nation’s marginalized communities. Growing by nearly 800 companies this year, it continues to serve as the largest lens into the prison industrial complex ever published. While this report still far from covers all the private sector companies in this space, it captures all its major players.
At Worth Rises, our hope is that advocates, litigators, journalists, investors, and the public will use the report to further understand the expansive nature of the prison industrial complex and familiarize themselves with its players. This report should serve as a resource in the fight against the commercialization of our criminal legal system.
Prison Profit-Tears, Paul Cortez, Green Haven Correctional Facility, NY
A Note From The Authors
All engagement is not equal, but all engagement is an opportunity for action.
The inclusion of a corporation in this report does not itself signify anything about the corporation’s values or even perspective with respect to the travesty of our carceral crisis. Due to the vast reach of our criminal legal system, companies have found themselves unintentionally implicated in the prison industrial complex without even knowing it. It is for this reason that we chose not to simply publish a list of names, but rather a rich data set that includes important corporate information and our sources.
The data provided in this report should serve as a launching pad for further exploration. Readers should engage and analyze the data but follow up with their own investigations before making decisions about what approach to take in challenging each corporation’s involvement in the prison industrial complex.
To organizers and advocates, we hope this report will help you identify targets for corporate campaigns, layer in an understanding of public-private partnerships, and build power among the public through exposure and education.
To elected officials, we hope this report will help you challenge the corporate exploitation of vulnerable communities and turn down political contributions from corporations looking to expand the reach of the criminal legal system.
To litigators, we hope this report will help you identify potential targets for litigation using consumer and other types of commercial law and return extracted resources to exploited people.
To media, we hope this report will serve as a starting point for your critical coverage of the detrimental impact and expansive grasp of the prison industrial complex and its unique players.
To investors and financial advisors, we hope this report will help you screen your investment portfolios for exposure to the prison industrial complex and determine what form of economic activism—shareholder engagement or divestment—is appropriate.
To artists, we hope this report inspires you to create works that amplify the harms caused by the commercialization of the criminal legal system and reach masses often inaccessible to other advocates.
We look forward to seeing your action.
#PeopleOverProfit
What’s New This Year
Over the past year, the authors made the following additions and updates to The Prison Industrial Complex: Mapping Private Sector Players.
Expanded geographic coverage into the west with the addition of California’s correctional vendors
Added corporations involved in immigration detention and flagged previously included corporations also involved in immigration detention
Added major bail bonds agencies and the surety companies that back them
Added stock tickers for all publicly traded corporations and their subsidiaries
Added corporate campaign contributions made by the largest private sector players in the prison industrial complex since 2010
Updated all financials with the most recently available data as of year-end 2018
Continued research into the prison industrial complex and added newly identified corporations
Vetted and, as appropriate, added corporations submitted to Worth Rises online
This year’s edition of The Prison Industrial Complex: Mapping Private Sector Players includes 3,905 companies.
Sector Summary & Developments


DATA
Methodology
I. Corporate Identification
A. State Correctional Spending
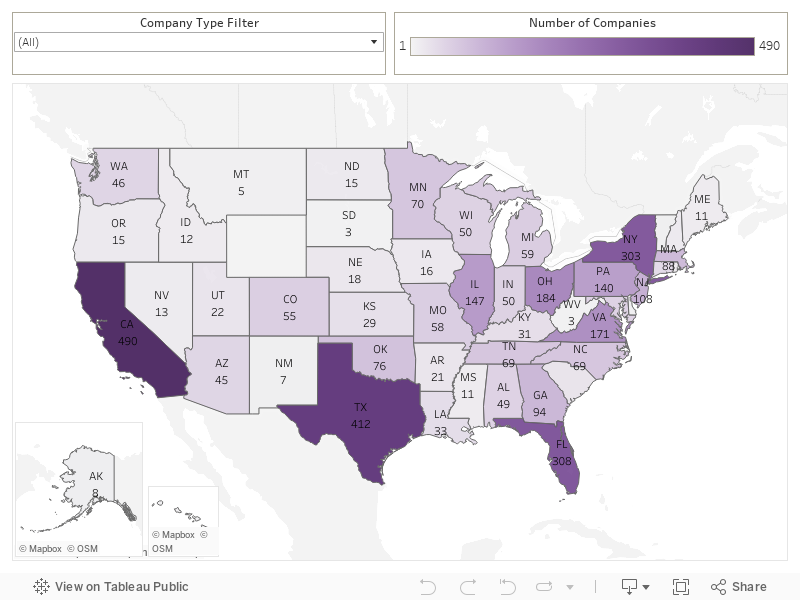
The authors analyzed the annual corrections spending of five states, each of which has the largest incarcerated population within its geographic region: California (West;129,593), Florida (Southeast; 101,424), New York (Northeast; 51,727), Ohio (Midwest; 52,233), and Texas (Southwest; 163,909). From the annual spending data of each state, the authors included the name of every for-profit, private vendor paid $150,000 or more by the state’s correctional agency. By focusing on the largest correctional systems in each region, the authors captured not just the largest national players, but also the largest regional players.
State detail and sources:
For California, the authors analyzed the California Department of Corrections and Rehabilitation’s CY 2018 spending using the State Contracting and Procurement Registration System (caleprocure.ca.gov/pages/public-search.aspx).
For Florida, the authors analyzed the Florida Department of Corrections’ FY 2017 spending using the State of Florida Vendor/Payee Payments System (fs.fldfs.com/dispub2/newvpymt4.shtml) and contracts, grant awards, and purchase orders using the Florida Accountability Contract Tracking System (facts.fldfs.com/Search/ContractSearch.aspx).
For New York, the authors analyzed the New York State Department of Corrections and Community Supervision’s FY 2017 spending using New York Open Book – Spending (wwe2.osc.state.ny.us/transparency/spending/spndMain.cfm). The authors also analyzed current contracts as of February of 2018 using New York Open Book – Contracts (wwe2.osc.state.ny.us/transparency/contracts/contractsearch.cfm) and included any for-profit, private vendor with a contract valued at $1,000,000 or more.
For Ohio, the authors analyzed the Ohio Department of Rehabilitation and Corrections’ FY 2017 spending using Ohio Checkbook (ohiotreasurer.gov/Transparency/Ohios-Online-Checkbook).
For Texas, the authors analyzed the Texas Department of Criminal Justice’s FY 2016 spending using the Texas State Spending Transparency Visualizations (comptroller.texas.gov/transparency/spending/visualizations.php) and included any for-profit, private vendor that was paid $50,000 or more.
B. Federal Spending
Correctional Spending
The authors reviewed the U.S. Department of Justice spending data available at USAspending.gov (www.usaspending.gov/). However, this source does not cleanly parse out spending specific to the Federal Bureau of Prisons nor does it aggregate total agency payments by vendor. Consequently, the authors could not conduct a systematic analysis of federal correctional spending to identify for-profit, private vendors paid $150,000 or more by the Federal Bureau of Prisons as intended. It is possible that vendors to the Federal Bureau of Prisons are underrepresented in this report.
Immigration Detention Spending
The authors analyzed the annual immigration detention spending of the U.S. Department of Homeland Security Immigration and Customs Enforcement (ICE) from July 2017 to June 2018 using GovSpend (www.govspend.com/) and the agency’s current contracts as of July of 2018 compiled by Sludge (readsludge.com/2018/07/06/who-is-making-money-from-ice-in-your-state/) and included the name of every for-profit, private vendor paid $150,000 or more by the agency.
C. Corrections and Law Enforcement Associations
The authors reviewed and included the corporate sponsors, partners, affiliates, and members of national corrections and law enforcement associations as well as the vendors listed in their professional marketplaces where available and accessible as of April 2018. More specifically, the authors reviewed the American Correctional Association, Association of State Correctional Administrators, American Jail Association, American Parole and Probation Association, Association of Women Executives in Corrections, National Association of Blacks in Criminal Justice, National Organization of Hispanics in Criminal Justice, National Sheriffs’ Association, National Correctional Industries Association, Corrections Technology Association, Association of Public-Safety Communications Officials, Integrated Justice Information Systems Institute, and the National Law Enforcement Telecommunications System.
D. Advocacy Resources, Media Articles, and General Search
The authors reviewed hundreds of reports, articles, and resources published by other criminal justice and immigration detention organizations and reputable media outlets covering the prison industrial complex and its corporate players. The authors also conducted broader web searches using keywords that produced additional corporate names.
E. Other
For simplicity, the authors aggregated or omitted certain types of corporate correctional vendors:
The authors aggregated local car dealership franchises under the corporate car manufacturer.
The authors excluded single or limited partner medical and legal practices, single or limited partner property realty companies, and hotels or lodging used for staff travel.
II. Corporate Data & Sources
Most information provided for each listed corporation was taken directly from its website or the online presence of its subsidiary or parent company. State budget data, press releases, advocacy reports, and media articles also provided critical information about the listed corporations. The source columns provide the major information sources for each listed corporation.
A. Active Brand
Demarcates corporations that are still active under the listed corporate name and those that are not. Corporations marked “N” are no longer operating under the listed corporate name but may have been acquired and rolled into another corporation. See “Notes” for details.
B. Headquarters Location
State or country of corporate headquarters of the listed corporation.
C. Number of Employees
Number of people employed by the listed corporation.
D. Year Founded
Year the listed corporation or its direct predecessor(s) was founded.
E. Year Last Acquired
Year the listed corporation was last acquired either directly or indirectly through the acquisition of a parent company by either an industry competitor or financial investor (e.g. private equity firm). See “Parent Company,” “Owner/Major Investor,” and “Notes” for more information.
F. Corporate Structure
Parent Company
The parent company of the listed corporation if it is a subsidiary of a larger corporation or holding company. See “Notes” for acquisition information.
Owner/Major Investor
Any major private equity investors of the listed corporation. Some major investors may hold a minority stake. See “Notes” for acquisition and investment information.
Stock Ticker
The stock ticker of the listed corporation or its parent company if publicly traded on any international stock market.
Public Exposure
The listed corporation’s level of public exposure based of its parent company or investor:
Tier 1a - Publicly Traded - Targeted Correctional Exposure: Corporations that are publicly traded on any international stock market and have a business segment targeting the prison industrial complex in their business model or through marketing, advertising, or sponsorships.
Tier 1b - Publicly Traded - Other: Corporations that are publicly traded on any international stock market and are presumed to be unintentionally or unknowingly engaged in the prison industrial complex.
Tier 2 - Private Equity-Owned: Corporations that are privately held and owned or heavily invested in by private equity investors.
Tier 3 - Large Privately-Owned, Requires Outside Financing: Corporations that are privately held and have or are estimated to have $200 million or more in annual revenues and likely require corporate financing for growth.
Tier 4 - Small Privately-Owned: Corporations that are privately held and have or are estimated to have less than $200 million in annual revenues.
G. Business Sectors
Using publicly available information, the authors assigned each listed corporation to at least one sector and one subsector. For corporations that operate in more than one sector or subsector, the authors assigned a secondary sector and subsector. For corporations that operate in more than two distinct sectors or subsectors, the authors listed the two most dominant. Because not all business models fit neatly into the defined sectors or subsectors, the authors encourage readers to delve further into the business models of corporations that draw their interest.
H. Immigration Detention Engagement
Demarcates corporations that engage in immigration detention.
I. Financials
The authors collected financial information from U.S. Securities and Exchange Commission (SEC) filings, annual reports, and Intrinio for publicly traded companies; acquisition announcements for acquired corporations and parent companies; and PrivCo for privately held corporations, as available. Intrinio maintains a public company financial database for members. PrivCo maintains a private company financial database for members. The authors also used data from the National Institute on Money in Politics to report political spending.
Annual Revenues ($Mn)
The actual or estimated annual revenues of the listed corporation in USD million for the last available year. Figures are specific to the listed corporation, not its parent company or a subsidiary. Revenue figures include all reported revenues for the listed corporation and should not be interpreted as revenues generated specifically from the prison industrial complex.
Revenue Year
Fiscal year of the reported revenue figure.
PIC Revenue Only
Demarcates corporations with business models that are entirely dependent on the prison industrial complex (PIC) from those that are only partially engaged.
J. Political Spending Since 2010
Working with the National Institute on Money in Politics, the authors gathered date on corporate campaign contributions made to federal and state candidates, major party committees, and ballot measure committees since 2010 by the largest private sector players in the prison industrial complex. The data also included contributions made to political campaigns in a few local races, namely city elections in Chicago, New York City, and Washington D.C. and supervisor elections in Orange County, California.
K. Notes
Any information detail that may add color beyond what the data already offers.
L. Sources
Website
Corporate website for the listed corporation.
Corrections Source
Source for proof of engagement in corrections for the listed corporation. Corrections sources may be references to the corporation’s general website, a specific page on its website, its relation to a subsidiary or parent in the data, a trusted advocacy report, a credible media article, or a corrections agency’s spending data.
Immigration Detention Source
Source for proof of engagement in immigration detention for the listed corporation. Immigration detention sources may be references to the corporation’s general website, a specific page on its website, its relation to a subsidiary or parent in the data, a trusted advocacy report, a credible media article, or an immigration agency’s spending data.
Financials Source
Source of financial information for the listed corporation.
Other Source
Any other direct source relevant to the listed corporation. The most common other sources are press releases providing acquisition details, proof of the sponsorship of correctional or law enforcement associations, and other media coverage.
III. Limitations
A. Corporate Identification
Regional, Size, and Agency Coverage
This report systematically looked at the correctional spending of five states and, in large part, only included corporations collecting over $150,000 annually. Looking broader into other states and local agencies or lowering the payment threshold would likely produce thousands of additional corporate names. As discussed above, the report is also limited in its coverage of correctional vendors serving the federal government.
Accurate not Exhaustive
The authors chose to include only companies that they could determine with confidence are currently engaged in the prison industrial complex whether as standalone corporations, active subsidiaries, or absorbed predecessor companies.
There are lists that charge major publicly-traded consumer products corporations with profiting from prison labor. And while likely accurate accusations at the time of their publishing, they may now be outdated. Choosing to preserve the integrity of the corporate identification process, the authors have decided against including these corporations without additional corroboration of their continued engagement.
Obscurity of Prison Labor
Given the lack of transparency in corporate supply chains, this report is likely limited in its coverage of corporations benefiting from prison labor. However, it does capture suppliers of raw materials to correctional industries, an aspect of prison labor that is often overlooked, given that their purchases are reflected in state spending data. Unfortunately, state revenue data, which would capture corporations that consume products created using prison labor, is not readily accessible.
B. Corporate Data
Dominance of Privately Held Companies
The overwhelming majority of corporations that operate in the prison industrial complex are privately-held. Thus, collecting information about their business models, corporate structures, and financial performance is incredibly difficult. Accordingly, there are gaps in corporate data for many of the listed corporations, including major players in the prison industrial complex.
Limitations of Sector Designations
In an effort to organize the thousands of corporations that operate in the prison industrial complex, the authors created a set of 12 industry sectors plus investors and a structure of subsectors that fits within them. However, not every corporation neatly fits into one of these sectors. While the authors have made their best effort to appropriately categorize every listed corporation, they encourage readers to follow the provided sources for clarity.
Underestimate of Political Influence
Political contributions are generally difficult to trace. The authors worked with the National Institute on Money in Politics to analyze the political spending of the largest private sector players in prison industrial complex. While the spending data captures campaign contributions to federal and state candidates, major party committees, and ballot measure committees, it is short on contributions made to local campaigns and initiatives. The data also omits corporate contributions made to political action committees and individual campaign contributions made by affiliated corporate executives, two common vehicles for political contributions. Finally, importantly, lobbying spending is also not captured in the data. Accordingly, the authors warn that the political spending figure is likely to be a significant underestimate.
Acknowledgements
Worth Rises graciously acknowledges everyone whose time, energy, and passion went into the development of this report. We specifically thank Luke Noel, Dana Rasso, Hannah Ambinder, Connor McCleskey, Benjamin Finegan, Adam Vagner, Pete Quist, Komala Ramachandra, Ben Davis, Ron Torok, and Intrinio for their research contributions and editing assistance.